Empowering Spectrum Analysts
Features
The Spectrum Interference Dashboard helps spectrum analysts streamline their workflow by providing data insights, customizable visualizations, and user-friendly navigation. It facilitates the quick identification of anomalies, enabling decision making with ease and significantly increasing the efficiency of evaluative tasks.

Visualizer
Observe satellite orbits for missions under evaluation and see exactly when interference occurs, where it occurs, and who it involves during a simulation. Know of mission operating hazards and who to coordinate with at a glance to avoid interference collisions.

Results Summary
Have a quick summary overview on overlapping operating frequencies based on whether the MUE is an interferer or victim, highest I/N values observed for each mission, and the I/N CCDF curve observed for the particular link pairs involved.

Report Generation
Save time by generating a word document report that has large quantities of information automatically filled out at a push of a button. It has tables detailing information on an MUE’s RF parameters, the worst case I/N values from each mission, as well as modifiable boilerplate text explaining the methodology used in an analysis.
Use Cases
Verify Orbital Motion and Visibility Between Objects
The Spectrum Interference Dashboard features a visualizer that transforms raw position and interference level data from interference scenario simulations into an interactive visualization, providing analysts the ability to observe spacecraft orbits in relation to their respective reference bodies and interfering and victim links so that interference interactions of concern can be identified and verified efficiently.


Create Custom Plots
The Spectrum Interference Dashboard provides an Analytics tab that allows users access to formatted plots created using Plotly in JavaScript. The user can take data used in the visualizer, such as contact duration events or information on the I/N between each link pair, and plot it however they wish. The outputted graph object can be easily implemented into reports.
Value Proposition
;
Determining the interference impacts to and from communications links or other emissions used by a space mission of interest can be a daunting task, especially in cases where there are a large number of systems that overlap in frequency and bandwidth. Teltrium’s Spectrum Dashboard provides an intuitive interface to visualize spacecraft motion and RF signal paths of missions of interest and overlapped systems and to display interference analysis results in tabular and graphical formats, thus facilitating the rapid identification of scenarios that may require further study and coordination to minimize harmful interference effects.

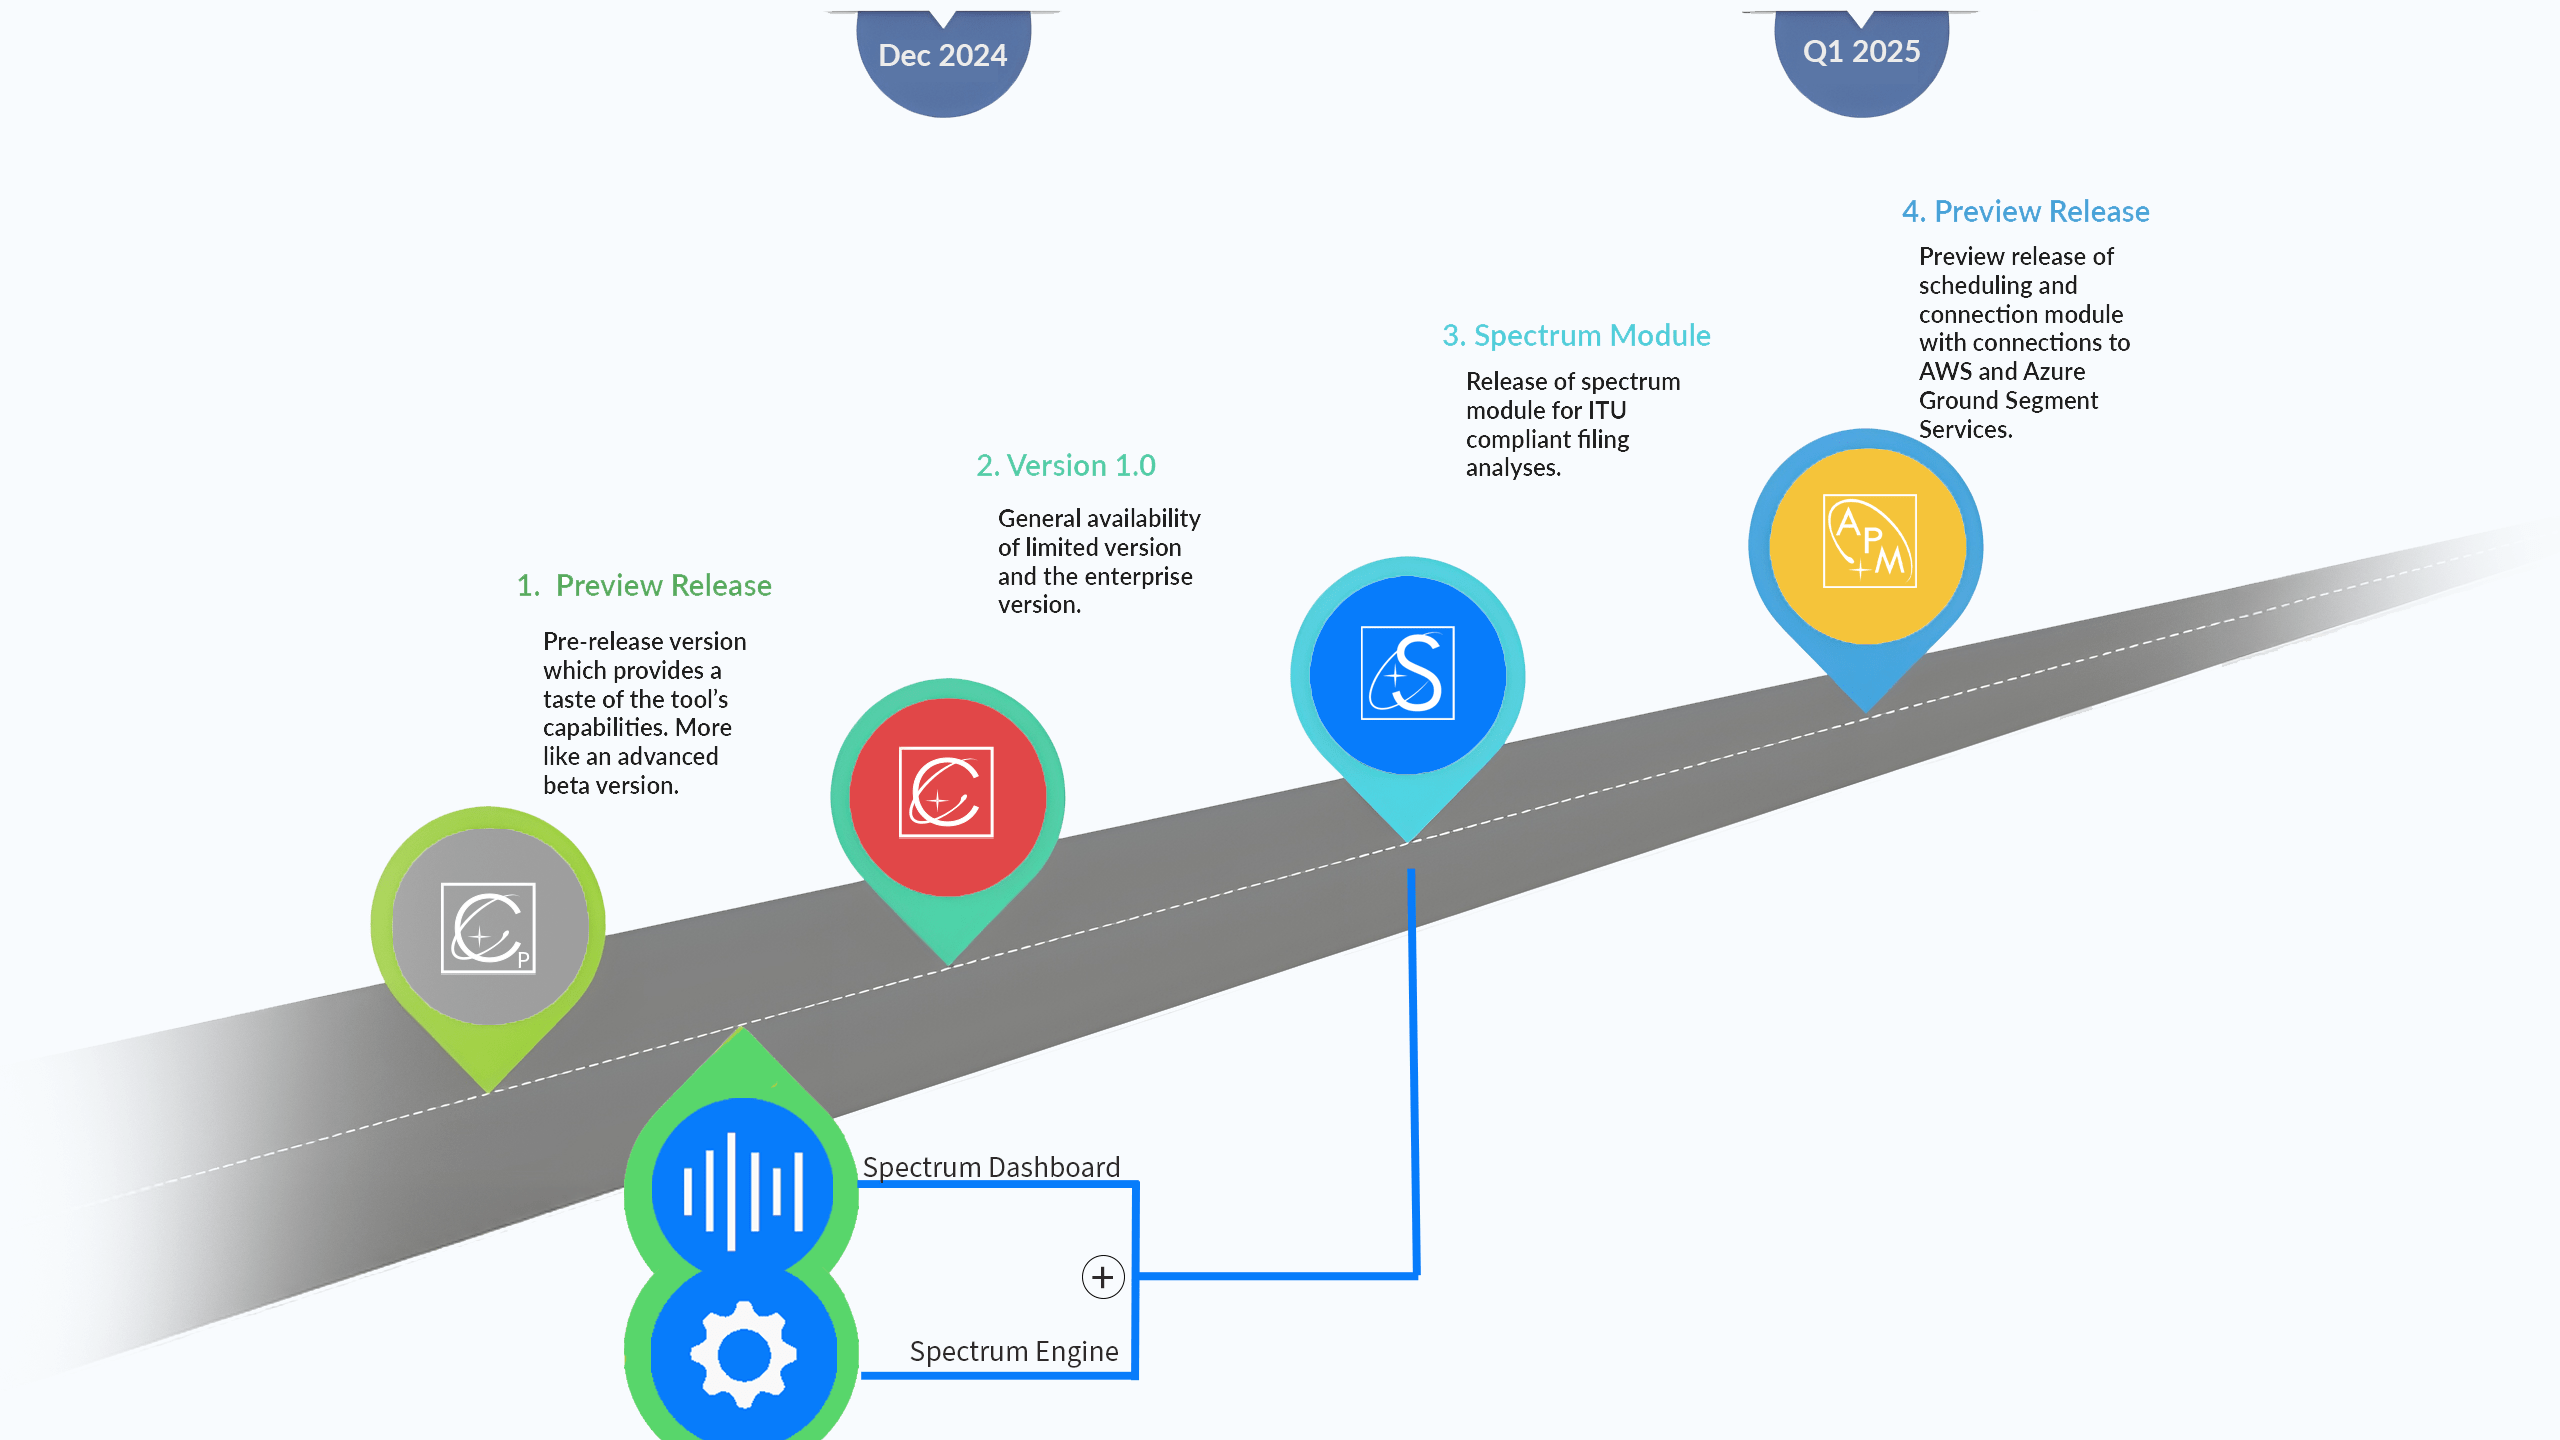
Roadmap

Ready to try the Dashboard out?
Teltrium is a technical services company that provides systems engineering and project execution support and capabilities to satellite communications and spectrum management technology programs for NASA and other customers. We’re a small company focused on nurturing an agile and innovative team, developing creative and high-quality solutions for our unique customers.